
Bar speed, measured from your phone
Velocity-based training without a sensor, a tether or anything attached to the bar. Film a set the way you already film one, and get per-rep speed, range of motion and an estimated 1RM back.
Your camera roll is already a training log
Nothing has to be recorded inside an app. Old clips count: set the recording date to when you filmed, and training you have already done turns into trends you can read.
Off your phone, and easy to find again
Analysis runs on our servers, not on your handset. There is no app to install and nothing to keep updated, and a five-year-old Android gets the same numbers as a new iPhone.
So the originals do not have to stay in your camera roll. Every set you upload is kept and indexed by lift, load, date, reps and RPE for as long as your account is active. Finding out how 140 kg moved last spring becomes a search instead of a scroll.
Stored in the EU, on Google Cloud in europe-west1. Yours to delete whenever you want.
Every rep, not just the set
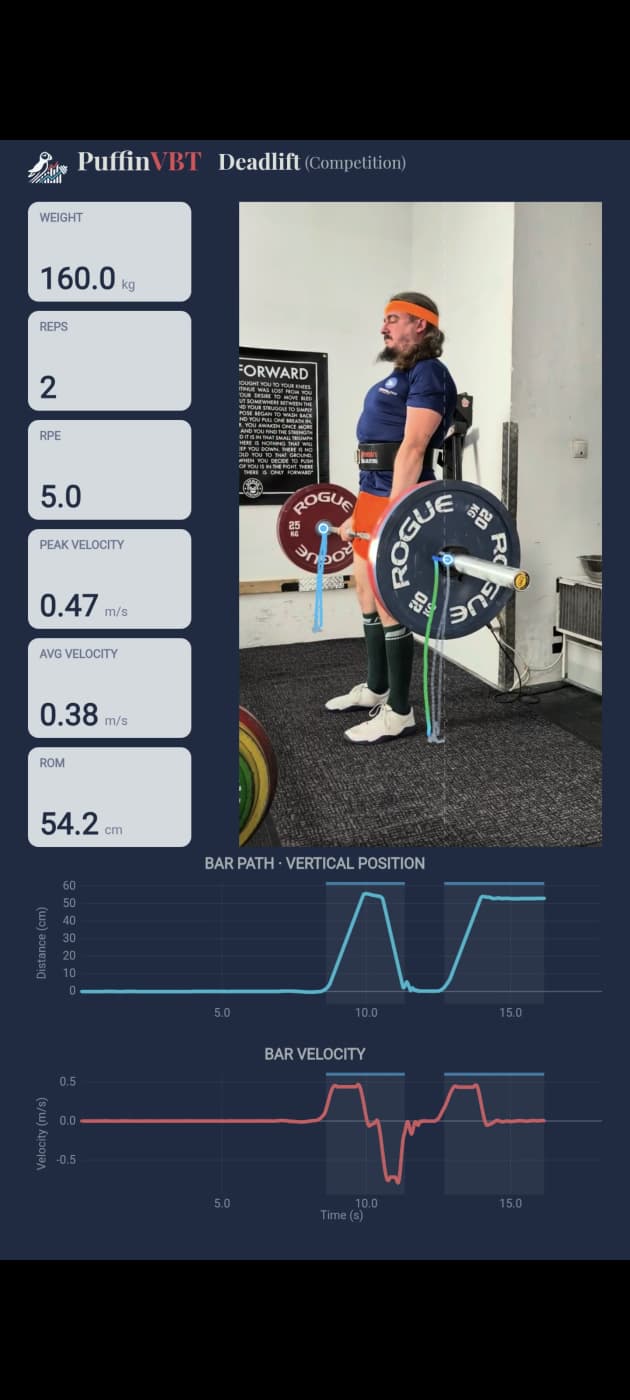
Not one number for the whole set. Every rep gets its own peak speed, mean speed and range of motion, so the rep that slowed down is something you can see rather than something you have to remember.
This is drawn live from a real analysed set. Open the full analysis.
Your own load-velocity curve
Heavier means slower, but how steeply is personal, and it differs between your squat, your bench and your deadlift. Log sets across a range of loads and the curve draws itself, one line per lift.
Once it exists it tells you what a given bar speed is worth in kilos, so you can read a warm-up single and know what kind of day it is.
Sample data below, so the shape is illustrative rather than somebody else’s numbers. Yours is built from your own sets. See the full trends view.
Two sets, side by side
The same lift on an easy day and a hard one, both speed traces laid over each other on one clock. Where the harder set falls away is the sticking point, and it is usually not where you would guess.
Both traces are measured, from real footage. Compare them in full.
Built for coaches too
Athletes film their own sets. You get their numbers, their trends and somewhere to reply, without buying a device for every one of them.
Try it on a video you already have
15 analyses free. No card, no hardware, no app to install.