VBT vs RPE: Competitors or Complements?
By Gunnar S. Knudsen · · 6 min read

RPE, Rating of Perceived Exertion, is a 1-10 scale for how hard a set felt. VBT, Velocity-Based Training, uses how fast the bar actually moved instead. Most lifters already know RPE. Fewer have used velocity. Here’s how the two compare, and why the best training uses both.
RPE is free, requires no equipment, and captures something velocity cannot: how the set felt to the lifter. Velocity is objective, requires a sensor or camera, and captures something RPE cannot: how the bar actually moved. These are not the same thing, and the gap between them is where the most useful training information lives.
What RPE Does Well
The RIR-based RPE scale (Zourdos et al., 2016) gives lifters a common language for set intensity. RPE 8 means you had about 2 reps left. RPE 10 means you had nothing left. It’s intuitive, it takes zero setup, and it captures the lifter’s internal experience of effort.
For programming, RPE is powerful because it autoregulates by default. “Work up to an RPE 8 triple” produces different absolute loads on different days, adapting naturally to sleep quality, stress, and cumulative fatigue. This is a meaningful advantage over rigid percentage prescriptions.
RPE also captures things velocity cannot. A set might move at a normal speed but feel terrible because of joint pain, a nagging tweak, or general malaise. Velocity won’t flag that. RPE will, because the lifter felt it.
Where RPE Falls Short
RPE has three well-documented weaknesses:
Calibration varies between lifters. What one lifter calls RPE 8, another calls RPE 7. Helms et al. (2016) found that trained lifters are reasonably accurate on average, but individual-set accuracy can be off by 1-2 RIR, especially at moderate intensities (RPE 6-8). The scale is more reliable near maximal effort (RPE 9-10) where the signal is unmistakable.
Calibration drifts within a lifter. During a hard training block, your perception of effort recalibrates. Week 6 RPE 8 might be genuinely harder than Week 1 RPE 8, but it doesn’t feel harder because you’ve normalized the suffering. This is insidious: the lifter thinks they’re maintaining intensity when they’ve actually drifted upward.
Ego and honesty. Some lifters consistently underrate RPE (ego lifting, wanting the log to look impressive). Others consistently overrate (sandbagging, wanting to feel like they’re working hard). These biases are stable enough to work around once you know them, but most lifters don’t know they have them.
What Velocity Does Well
Velocity gives you an objective number for every rep. The bar moved at 0.38 m/s. That number doesn’t change based on mood, sleep, or how honest the lifter is being. It’s a direct measurement of performance.
This objectivity is most useful in three situations:
Confirming or correcting RPE. If an athlete reports RPE 7 but velocity at that load is in their historical RPE 9 range, either the athlete is miscalibrating or something unusual is happening. Either way, the discrepancy is worth investigating.
Tracking progression at finer resolution than load jumps. The same weight moving 0.03 m/s faster this month than last month is real, measurable progress that won’t show up in RPE or absolute load for weeks.
Detecting fatigue accumulation. A gradual downward trend in velocity at a reference load over 3-4 weeks is one of the earliest signals of overreaching, often appearing before the lifter feels run down.
Where Velocity Falls Short
Velocity is not a complete picture either.
It doesn’t capture pain or discomfort. A set can produce normal velocity numbers while the lifter’s knee is aching or their lower back feels sketchy. RPE captures that qualitative information. Velocity doesn’t.
It requires a measurement tool. Whether that’s a hardware sensor or a phone camera, there’s some friction. RPE is always available.
Single-set noise. Any given set’s velocity can bounce around based on warmup quality, rest periods, mental focus, or technique variation. Velocity is most reliable as a trend over multiple sessions, not as a single-set judge.
What Happens When They Disagree
The most useful data comes from the overlap and the divergence between RPE and velocity.
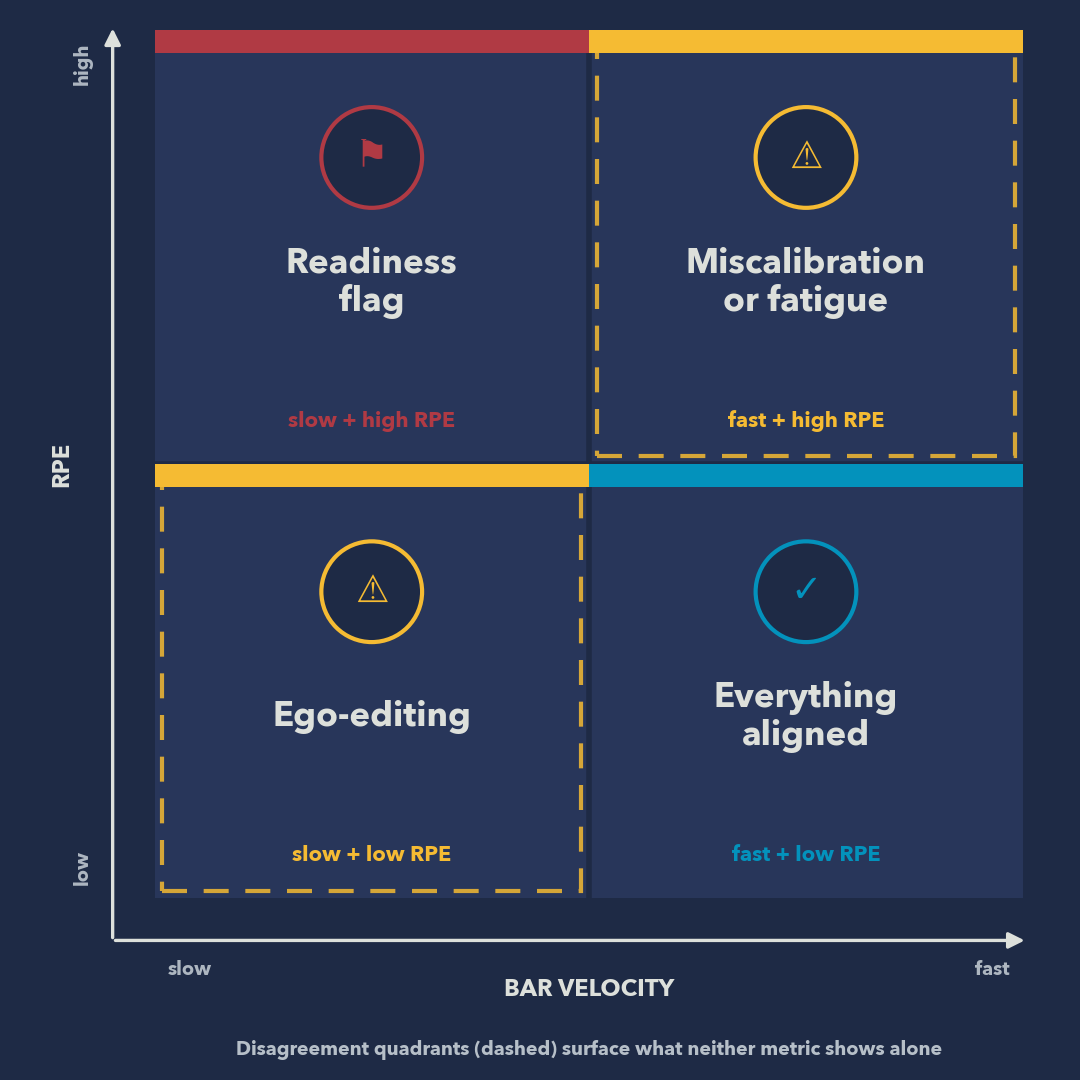
| Velocity | RPE | Interpretation |
|---|---|---|
| Fast | Low | Everything aligned. Good day, well-recovered, set was submaximal. |
| Fast | High | The bar moved well but felt hard. Possible causes: poor recovery, high accumulated fatigue, or RPE miscalibration (the lifter expects it to feel easier than it does at this speed). |
| Slow | Low | The bar was sluggish but felt easy. Classic ego-editing: the lifter is underrating effort. Or technique was very efficient (grinding through with good mechanics). |
| Slow | High | Both signals agree the set was hard. If this is at a load that’s normally moderate, it’s a readiness flag. |
The “fast bar, high RPE” and “slow bar, low RPE” quadrants are the interesting ones. They surface information that neither metric reveals alone.
A coach tracking both can spot an athlete who consistently underrates effort (velocity always suggests higher intensity than reported RPE) and recalibrate their programming accordingly. An athlete tracking both can learn their own biases over time.
Using Both in Practice
You don’t need a complicated system. The simplest approach:
Log RPE on every working set. You’re probably already doing this or can start with minimal friction. Be honest. The data is only useful if it reflects reality.
Track velocity on your top sets. Film the heaviest 1-3 sets per exercise from a side angle. Compare velocity at a given load across sessions.
Watch for divergence patterns. If RPE is dropping at a load but velocity is flat, you’re getting better at the skill of the lift (more efficient technique) rather than producing more force. If velocity is dropping at a load but RPE is stable, you’re accumulating fatigue that you haven’t noticed yet.
Trust both, but weight velocity for the mechanical question and RPE for the experiential question. “How fast did the bar move?” is a velocity question. “How did that feel?” is an RPE question. They’re both real, and they’re both useful.
The goal is not to pick one over the other. It’s to have two instruments reading the same signal from different angles, and to pay the most attention when they disagree.
PuffinVBT logs velocity alongside your RPE from a phone video, no sensor required, 15 free analyses to start.
Sources
- Zourdos, M.C., Klemp, A., Dolan, C., et al. (2016). Novel resistance training-specific rating of perceived exertion scale measuring repetitions in reserve. Journal of Strength and Conditioning Research, 30(1), 267-275.
- Helms, E.R., Cronin, J., Storey, A., & Zourdos, M.C. (2016). Application of the repetitions in reserve-based rating of perceived exertion scale for resistance training. Strength and Conditioning Journal, 38(4), 42-49.
- Gonzalez-Badillo, J.J., & Sanchez-Medina, L. (2010). Movement velocity as a measure of loading intensity in resistance training. International Journal of Sports Medicine, 31(5), 347-352.